R. Bras. Zootec.22/jun/2026;55:e20250130.
Colorimetric analysis of phosphorus concentration in animal feeds using images from smartphone or scanner – a proof-of-concept study
Suellen Sobrinho França Mattos
![]() , Crysthal Gonçalves da Silva
, Crysthal Gonçalves da Silva
![]() , Lorhaine Bernardes de Lima
, Lorhaine Bernardes de Lima
![]() , Laryssa Rodrigues Maia
, Laryssa Rodrigues Maia
![]() , Felipe Dilelis
, Felipe Dilelis
![]() , Tadeu Eder da Silva
, Tadeu Eder da Silva
![]() , Plinio de Freitas Martinho
, Plinio de Freitas Martinho
![]() , Luana Marta de Almeida Rufino
, Luana Marta de Almeida Rufino
![]() , João Paulo Pacheco Rodrigues
, João Paulo Pacheco Rodrigues
![]()
ABSTRACT
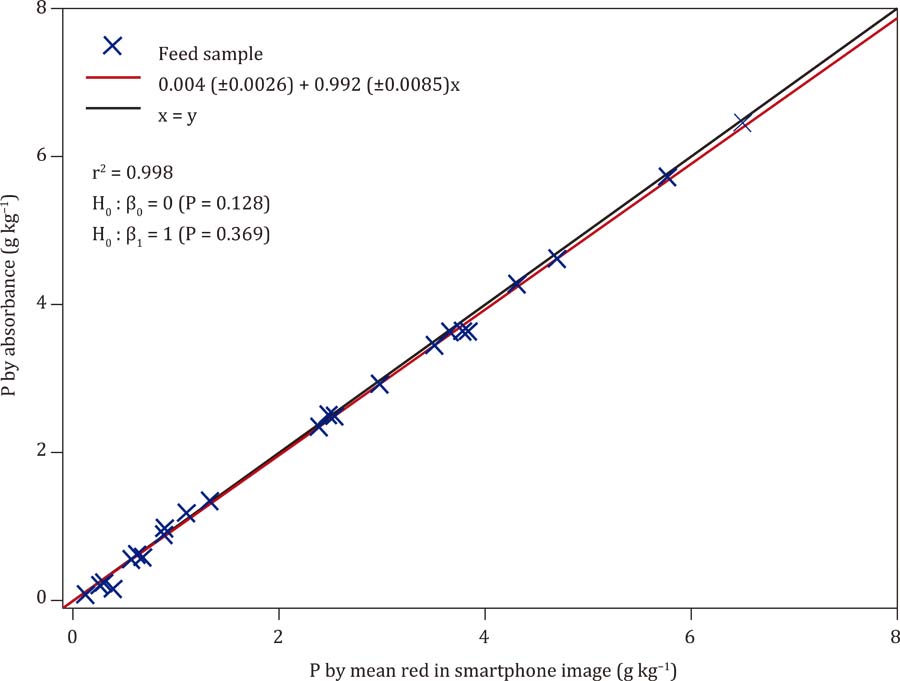
This study aimed to evaluate the potential of using images taken with a smartphone or scanner as alternatives to conventional spectrophotometry for phosphorus (P) analysis of feedstuff. Twenty-four samples of feed ingredients and commercial concentrates were evaluated. After acid digestion and dilution, the solutions were analyzed using the P-molybdate colorimetric reaction. Standards ranged from 0 to 1.4 mg L−1 at intervals of 0.2 mg L−1 of P in the reading solution. Standards and reading solutions were analyzed in ELISA microplates. The absorbance values of each cuvette were obtained using a spectrophotometer, and smartphone and scanner images were obtained sequentially. The images were segmented, and a circle was sampled in each cuvette to obtain the mean values of the red, green, and blue (RGB) channels. The P concentration was determined using linear regression of absorbance or the mean values obtained in the RGB channels as a function of P concentration. The repeatability (REP), limits of detection (LOD), and limits of quantification (LOQ) were calculated. Except for the scanner’s blue channel (P<0.10), image-based colorimetric methods provided similar P concentrations similar to those obtained by spectrophotometry (P>0.10). Using absorbance, the REP, LOD, and LOQ were 0.96%, 0.013, and 0.039 mg L−1, respectively. The best-performing image-based predictors were red and green channels of the smartphone, with REP, LOD, and LOQ values of 1.80%, 0.050, 0.150 mg L−1 and 2.11%, 0.074 and 0.223 mg L−1, respectively. The smartphone red channel spectrophotometric absorbance provided equivalent P concentrations at a 99% confidence interval. Smartphone images performed better than scanner images. The use of the mean red channel from smartphone images proved promising for determining P concentration in feeds.
Palavras-chave: absorbance; feed analysis; molybdenum blue; RGB